

PROJECT OVERVIEW
GorillaDesk → Google Sheets Dashboard Automation
- Category
- Automation & Integrations
- Type
- Workflow Automation
- Status
- Completed / Operational
THE SITUATION
Operational data existed in GorillaDesk, but reporting depended on moving it elsewhere.
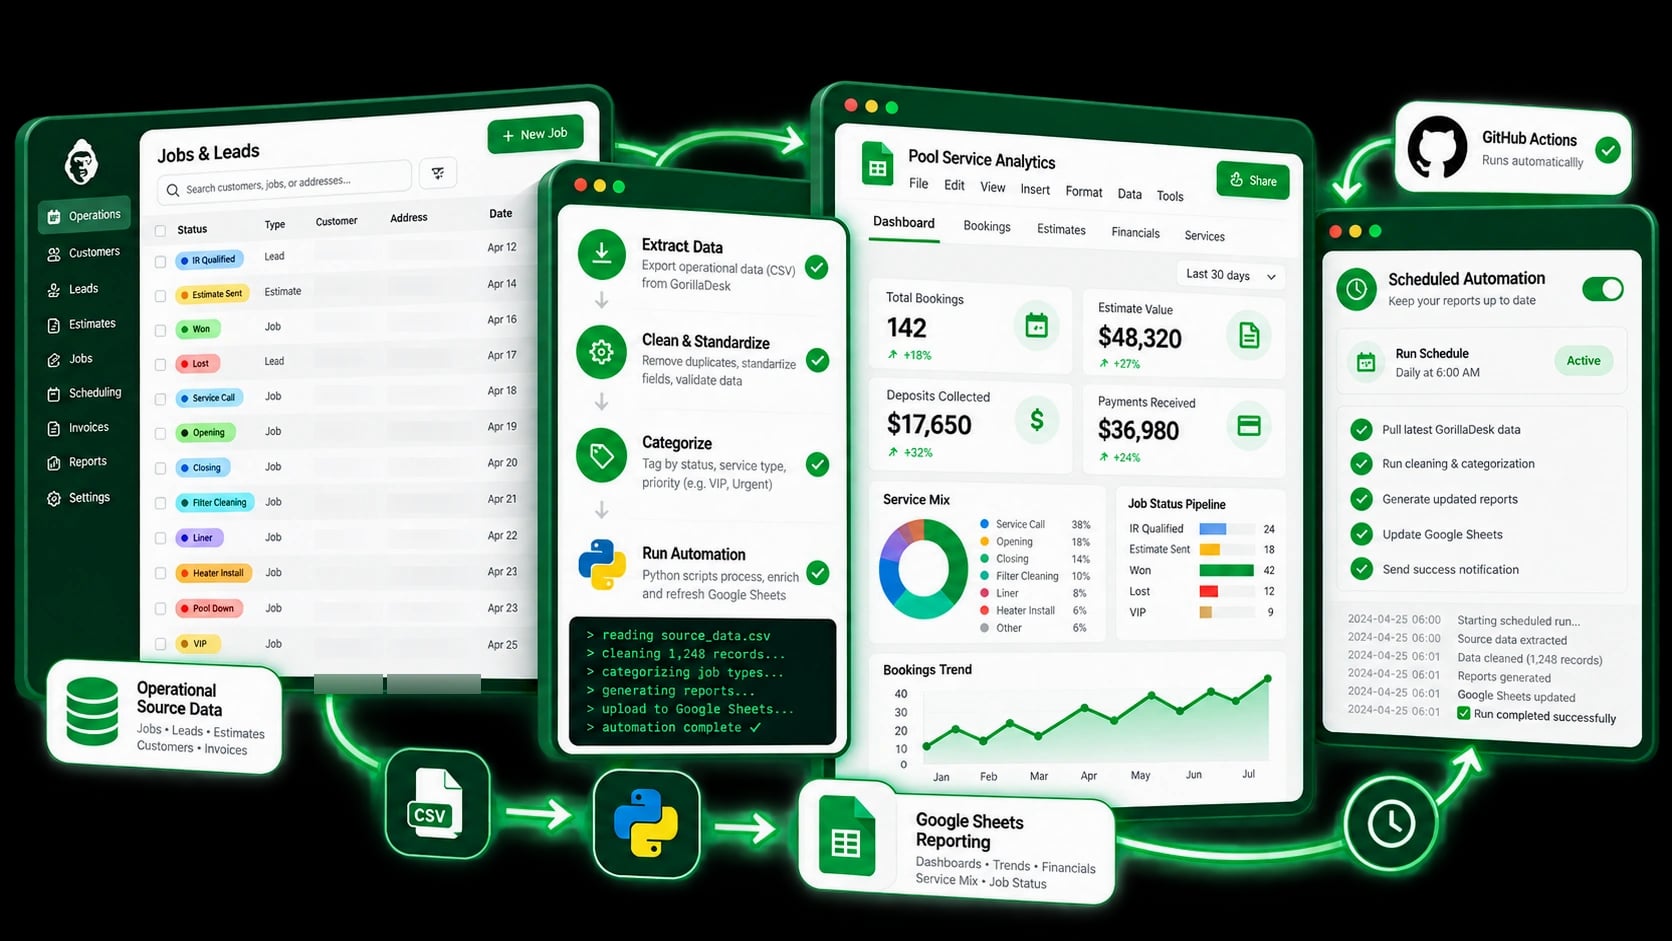
Service, repair, estimate, payment, and related operational records needed to reach structured Google Sheets reporting. Without an automated path, extraction, cleanup, categorization, and dashboard refresh required repeated manual handling.
WHY IT MATTERED
A dashboard is only useful when the data behind it stays current and structured.
- Operational records lived in GorillaDesk
- Exported data required cleanup and categorization
- Reporting depended on repeated refresh work
THE APPROACH
Build a controlled pipeline from operational data to reporting-ready tables.
The automation extracts the required GorillaDesk datasets, processes and categorizes the records, validates the resulting structure, and refreshes the Google Sheets reporting layer through an automated workflow.
VISUAL PROOF
System in action
See operational service data move from source system to reporting-ready dashboards.
THE OUTCOME
Dashboard refresh became an operational pipeline instead of a repeated manual data task.
Before
- Data extracted manually from the source system
- Records cleaned and categorized manually
- Reporting tables depended on manual preparation
- Dashboard refresh required repeated intervention
After
- Required datasets extracted through the automation
- Cleanup and categorization applied systematically
- Structured data prepared for the reporting layer
- Google Sheets reporting refreshed through the workflow
SYSTEM DETAILS
Project Details
- Category
- Automation & Integrations
- Type
- Workflow Automation
- Status
- Completed / Operational
Source
- GorillaDesk
Processing
- Python
Reporting
- Google Sheets
Automation
- GitHub automation / scheduled workflow
Key Functions
- Data extraction
- Cleanup
- Categorization
- Validation
- Dashboard refresh
THE TAKEAWAY