

PROJECT OVERVIEW
CSAT Analysis & Data Visualization
- Category
- Dashboards & Reporting
- Type
- Customer Experience Analytics
- Status
- Completed
THE SITUATION
Satisfaction responses provided a signal, while the operational reasons behind that signal lived elsewhere.
Survey results could be reviewed by themselves, but customer-experience analysis also needed context from call length, call drivers, zero-tolerance-policy violations, incorrect resolutions, issue types, repeat patterns, and supporting records.
THE ANALYSIS GAP
A satisfaction result could show sentiment without explaining the operational pattern behind it.
- Survey results and root causes needed one review path
- Long-call and policy-violation patterns required comparison
- Incorrect resolutions needed issue and team context
THE APPROACH
Connect customer feedback to the call-quality evidence that can explain it.
The analysis begins with survey results and root-cause breakdowns, then examines long calls, call drivers, zero-tolerance-policy violations, incorrect resolutions, issue types, repeat offenders, and supporting data.
VISUAL PROOF
Customer-experience signals in view
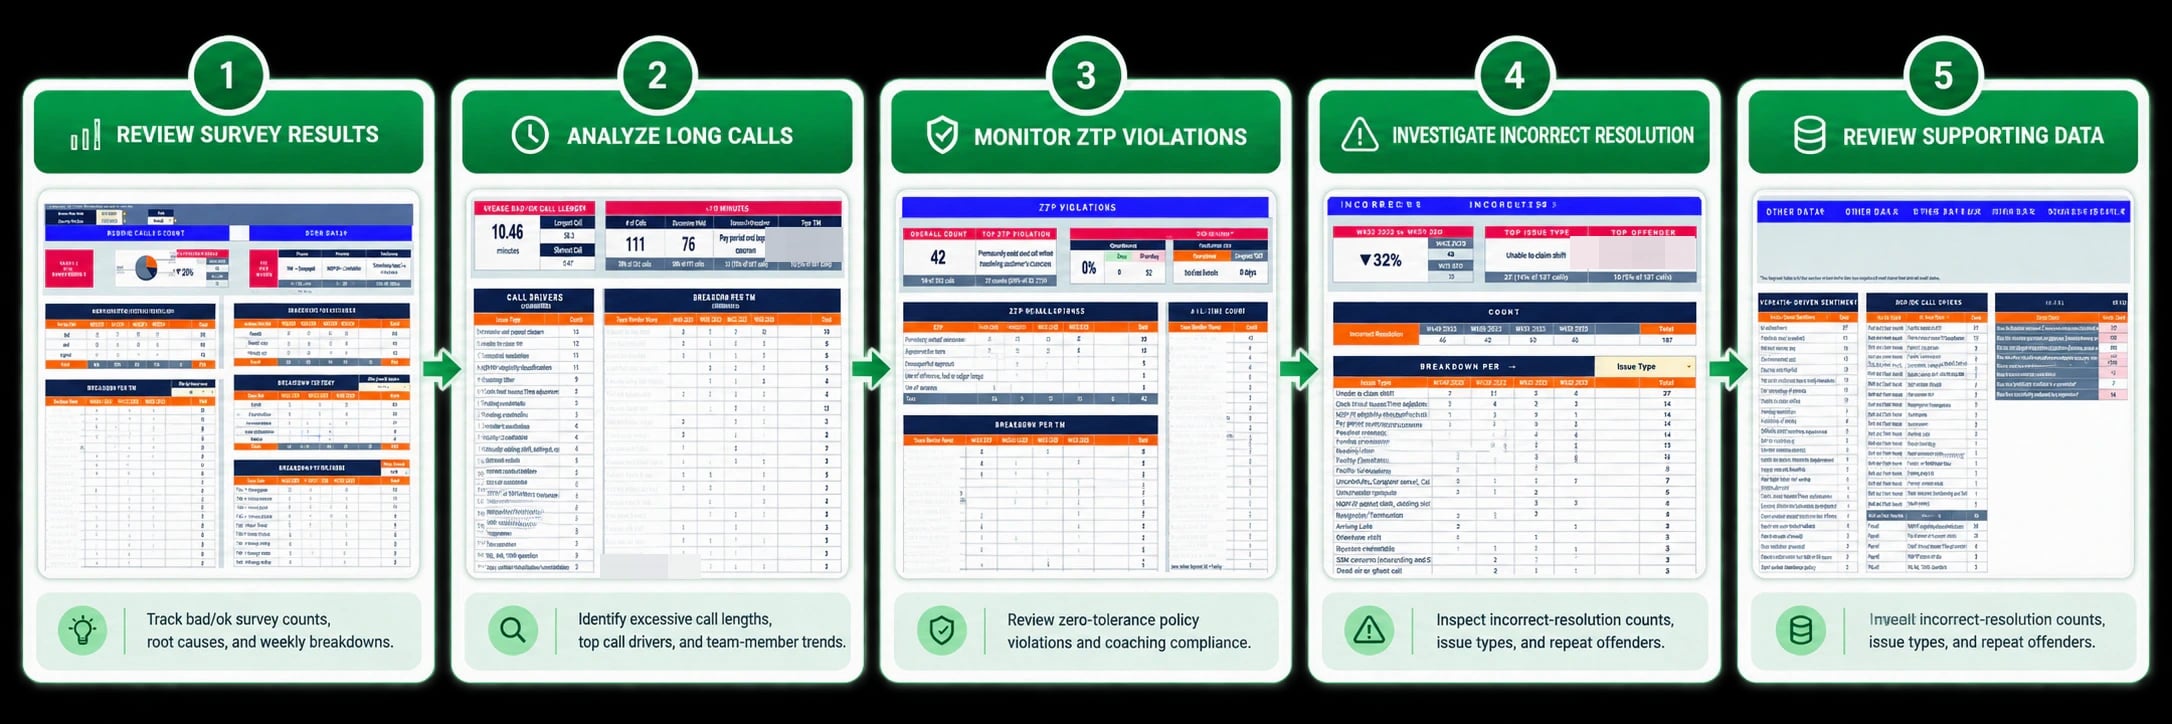
See survey results connect to long-call, policy, resolution, and supporting-data analysis.
THE OUTCOME
Customer-experience signals gained operational context beneath the satisfaction result.
INSIGHTS SURFACED
- Survey-result distribution, root causes, and weekly breakdowns
- Excessive call lengths, call drivers, and team-member patterns
- Zero-tolerance-policy violations and coaching compliance
- Incorrect-resolution issue types and repeat patterns
- Supporting records for deeper investigation
SYSTEM DETAILS
Project Details
- Category
- Dashboards & Reporting
- Type
- Customer Experience Analytics
- Status
- Completed
Data
- Survey results
- Call records
- Supporting records
Quality Signals
- Long calls
- Policy violations
- Incorrect resolutions
Analysis
- Root causes
- Weekly comparison
- Team patterns
- Issue types
THE TAKEAWAY