

PROJECT OVERVIEW
Automated QA Insights Dashboard
- Category
- Dashboards & Reporting
- Type
- Quality Analytics
- Status
- Completed
THE SITUATION
QA audits explained individual reviews, but recurring quality patterns needed a wider lens.
Audit scores, markdown attributes, critical errors, and team-member results provided case-level evidence. Quality review also needed to reveal which issues repeated across weeks and where the main drivers were concentrated.
THE ANALYSIS GAP
A score could show what happened in one review without showing what kept happening across the operation.
- Audit volume and overall scores needed shared context
- Markdown drivers required week-over-week and team views
- Critical errors needed recurring-pattern visibility
THE APPROACH
Organize audit data into overview, driver, critical-error, and team-level analysis.
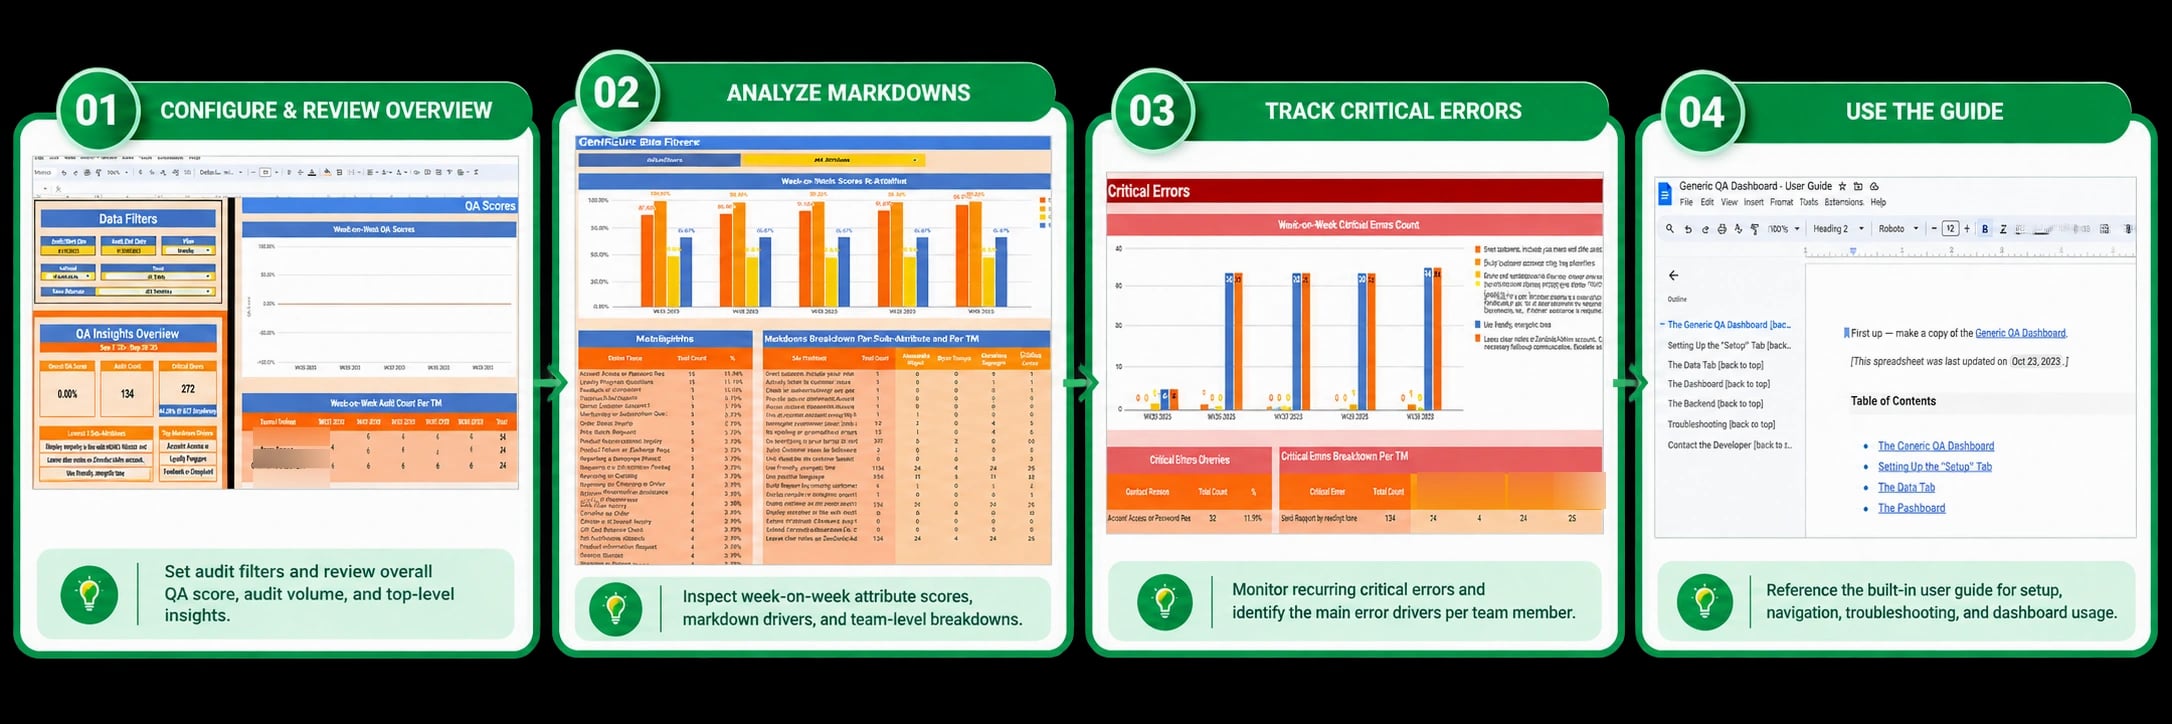
The dashboard applies audit filters, summarizes overall scores and volume, compares weekly attribute results, ranks markdown reasons, tracks critical errors by category and team member, and includes a guide for setup and use.
VISUAL PROOF
Quality patterns in view
See QA data move from overview metrics to markdown drivers, critical errors, and team-level detail.
THE OUTCOME
Quality review gained a structured view of recurring signals beneath individual audits.
QUALITY SIGNALS SURFACED
- Overall QA score and audit volume
- Week-over-week attribute scores and audit counts
- Markdown reasons and team-member breakdowns
- Critical-error categories, counts, and recurring drivers
- Setup, navigation, troubleshooting, and usage guidance
SYSTEM DETAILS
Project Details
- Category
- Dashboards & Reporting
- Type
- Quality Analytics
- Status
- Completed
- Platform
- Google Sheets
Data
- QA audits
- Scores
- Markdowns
- Critical errors
Analysis
- Week comparison
- Attribute drivers
- Team breakdowns
Support
- Filters
- User guide
- Troubleshooting reference
THE TAKEAWAY