

PROJECT OVERVIEW
Investor Interaction & Investment Analysis
- Category
- Dashboards & Reporting
- Type
- Sales / Investment Analytics
- Status
- Completed
THE SITUATION
Investor conversations and investment records described different parts of the same journey.
Engaged-lead activity showed who moved toward funding, while offering-level records showed investment amounts, funded-versus-waitlist status, monthly activity, and class distribution. Those dimensions needed a shared analysis context.
THE ANALYSIS GAP
Interaction activity could not explain investment composition unless lead outcomes and offering data were connected.
- Engaged-lead outcomes needed funding context
- Monthly investment activity needed comparison
- Offering and class distributions were separate analytical views
THE APPROACH
Connect investor engagement outcomes to offering-level investment composition.
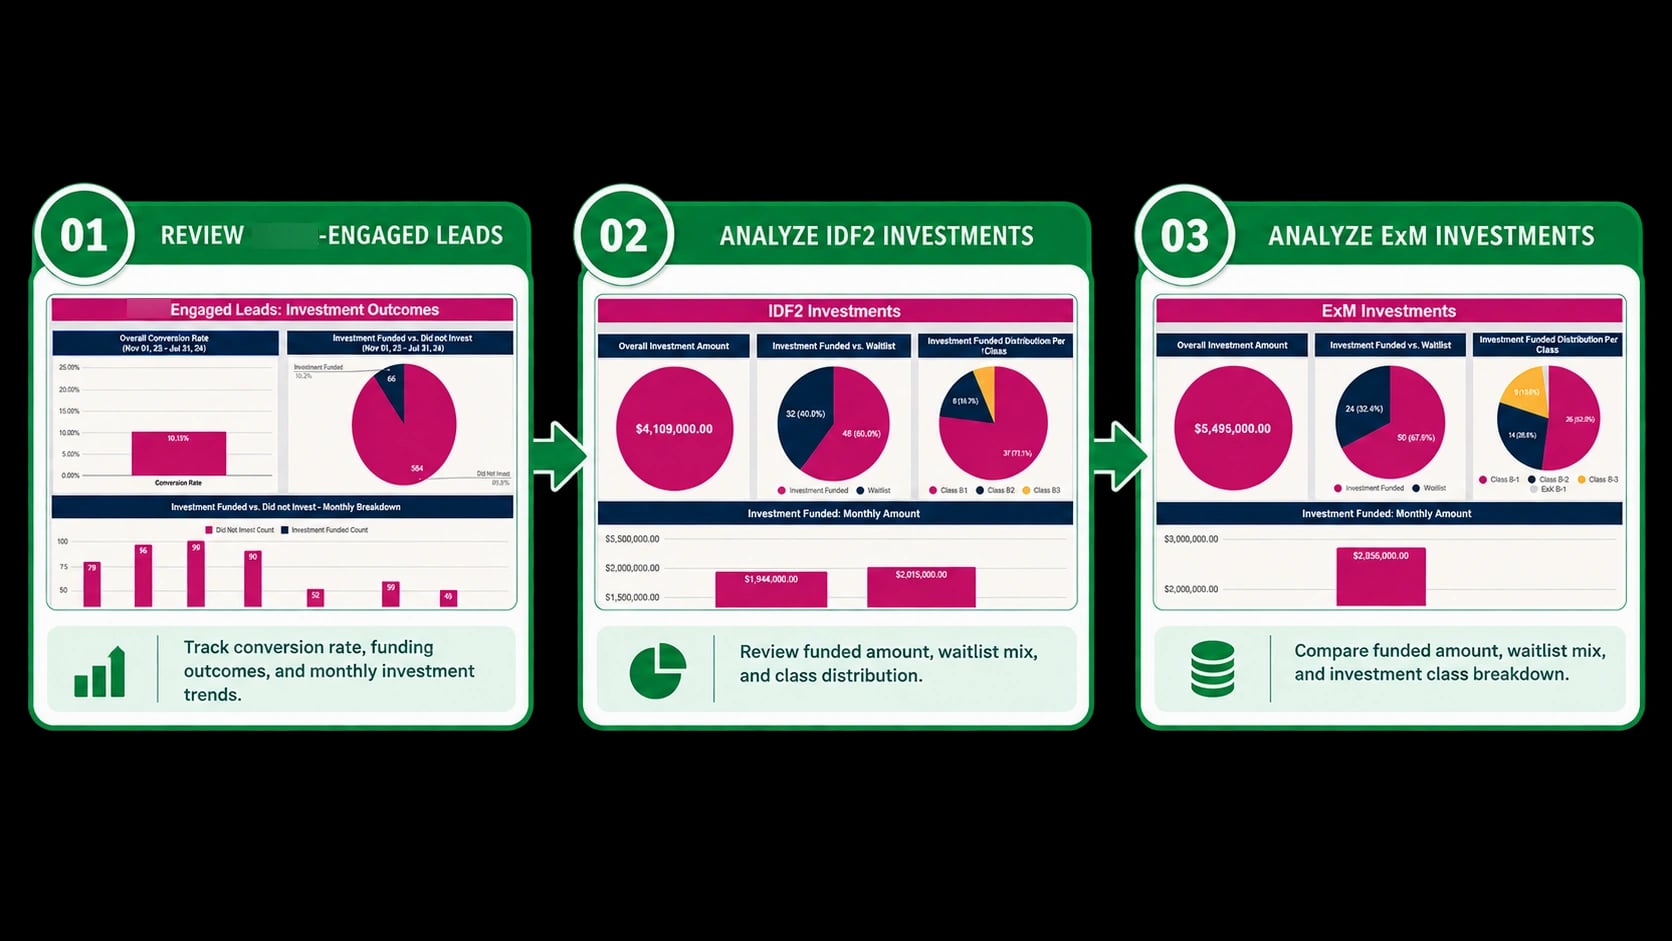
The dashboard separates engaged-lead conversion and funding outcomes from offering analysis, then compares funded amounts, waitlist mix, monthly investment activity, and investment-class distribution across the documented offerings.
VISUAL PROOF
Investment activity in view
See engaged-lead outcomes connect to funded amounts, waitlist mix, monthly activity, and investment classes.
THE OUTCOME
Investor activity became analyzable from engagement outcome through investment composition.
ANALYSIS ENABLED
- Engaged-lead conversion and funding outcomes
- Funded-versus-did-not-invest activity over time
- Investment amounts by documented offering
- Funded and waitlist composition
- Investment-class distribution within each offering
SYSTEM DETAILS
Project Details
- Category
- Dashboards & Reporting
- Type
- Sales / Investment Analytics
- Status
- Completed
Data
- Investor interactions
- Funding outcomes
- Offering records
Analysis
- Conversion
- Monthly activity
- Waitlist mix
- Class distribution
Output
- Engaged-lead view
- Offering analysis
- Investment comparison
THE TAKEAWAY