

PROJECT OVERVIEW
EOY Customer Analysis & Insights 2024–2025
- Category
- Dashboards & Reporting
- Type
- Customer Analysis & Reporting
- Status
- Completed
- Project
- View Project
THE SITUATION
Two years of customer records needed to explain change, not remain separate snapshots.
Year-end customer data included customer counts, revenue, retained relationships, net-new customers, churned customers, and the contribution of top accounts. The value came from comparing those dimensions across 2024 and 2025.
THE ANALYSIS GAP
Overall totals could not explain how customer composition and revenue contribution changed.
- Customer count and revenue needed year-over-year comparison
- Retained, net-new, and churned groups needed separation
- Top-customer contribution needed context within total revenue
THE APPROACH
Segment the customer base, compare periods, and connect composition to revenue.
The analysis aligns 2024 and 2025 customer and revenue totals, separates retained, net-new, and churned segments, calculates revenue-per-customer context, and compares top-customer revenue share and composition.
VISUAL PROOF
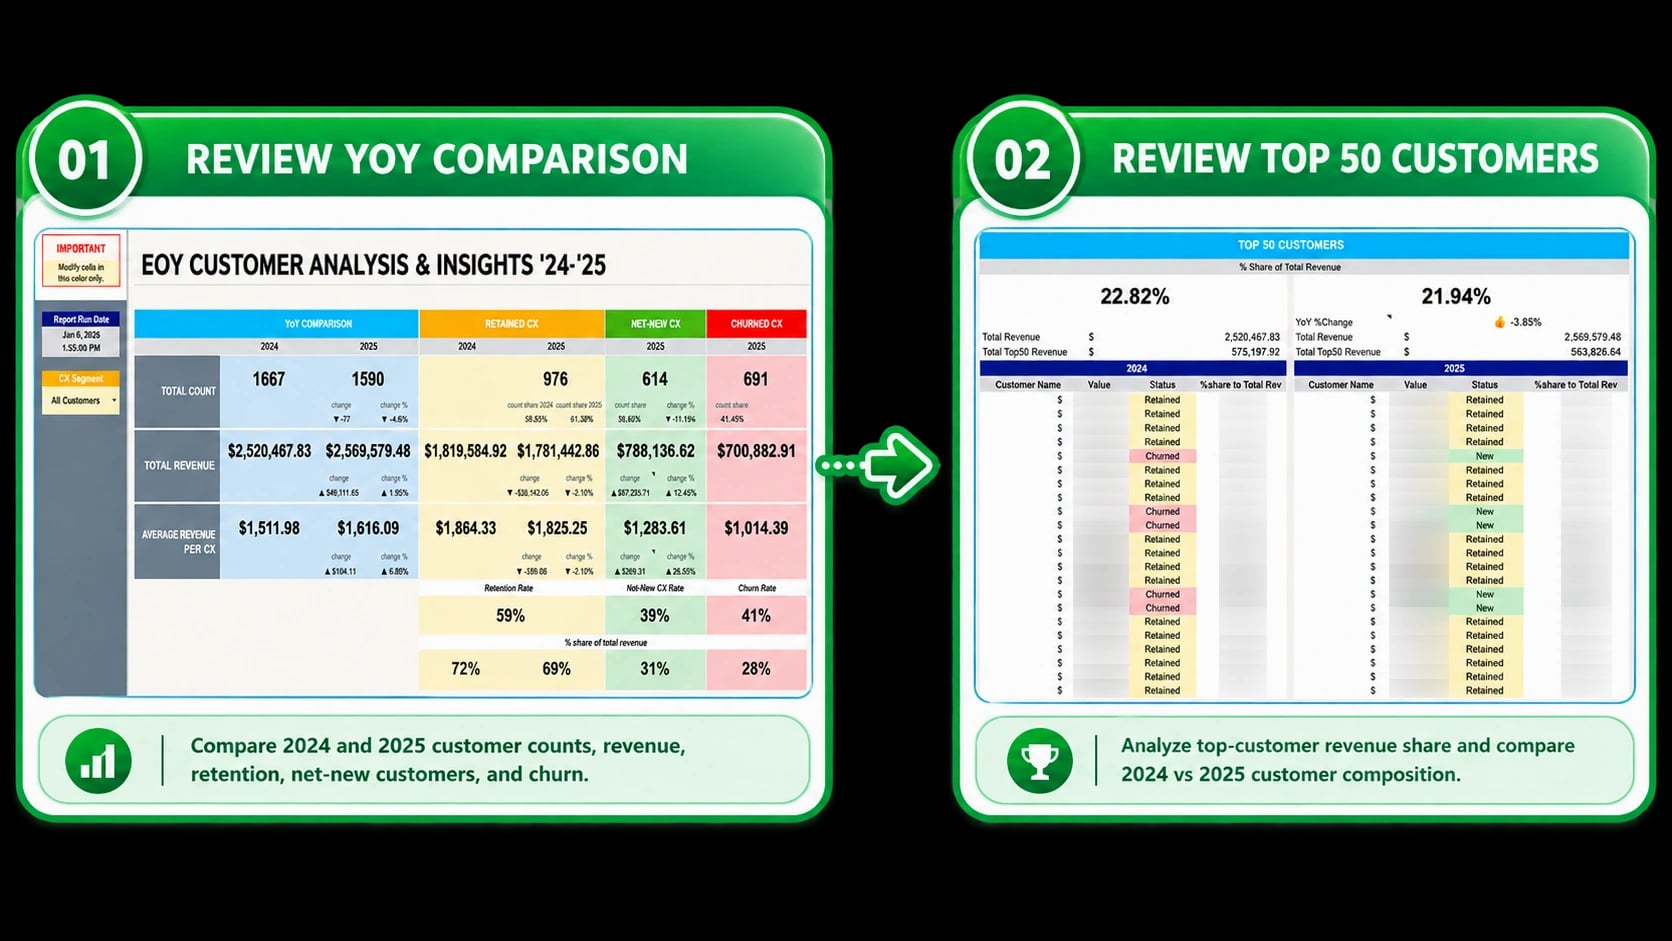
Year-over-year analysis in view
See customer count, revenue, retention, acquisition, churn, and concentration compared across 2024 and 2025.
THE OUTCOME
Historical customer data became a structured explanation of composition and change.
INSIGHTS SURFACED
- Year-over-year customer-count and revenue movement
- Retained, net-new, and churned customer composition
- Revenue contribution from each customer segment
- Average revenue per customer across the compared groups
- Top-customer revenue share and composition by year
SYSTEM DETAILS
Project Details
- Category
- Dashboards & Reporting
- Type
- Customer Analysis & Reporting
- Status
- Completed
- Platform
- Google Sheets
Period
- 2024
- 2025
Analysis
- Year-over-year comparison
- Customer segmentation
- Revenue share
Segments
- Retained
- Net-new
- Churned
- Top customers
THE TAKEAWAY