

PROJECT OVERVIEW
Gross Profit
- Category
- Dashboards & Reporting
- Type
- Business Reporting
- Status
- Completed
- Project
- View Project
THE SITUATION
Top-line activity showed sales, but it did not explain what remained after costs and discounts.
Service-level reporting needed to connect gross revenue, discounts, net sales, cost of sales, gross profit, and margin. Package pricing also needed comparable labor, chemical, discount, and profitability context.
THE REPORTING GAP
Revenue could describe activity while hiding the profitability structure beneath it.
- Revenue and cost information needed to be reviewed together
- Profitability needed date and service context
- Package options needed a consistent margin comparison
THE APPROACH
Build profitability from transaction detail, then compare the result across services and packages.
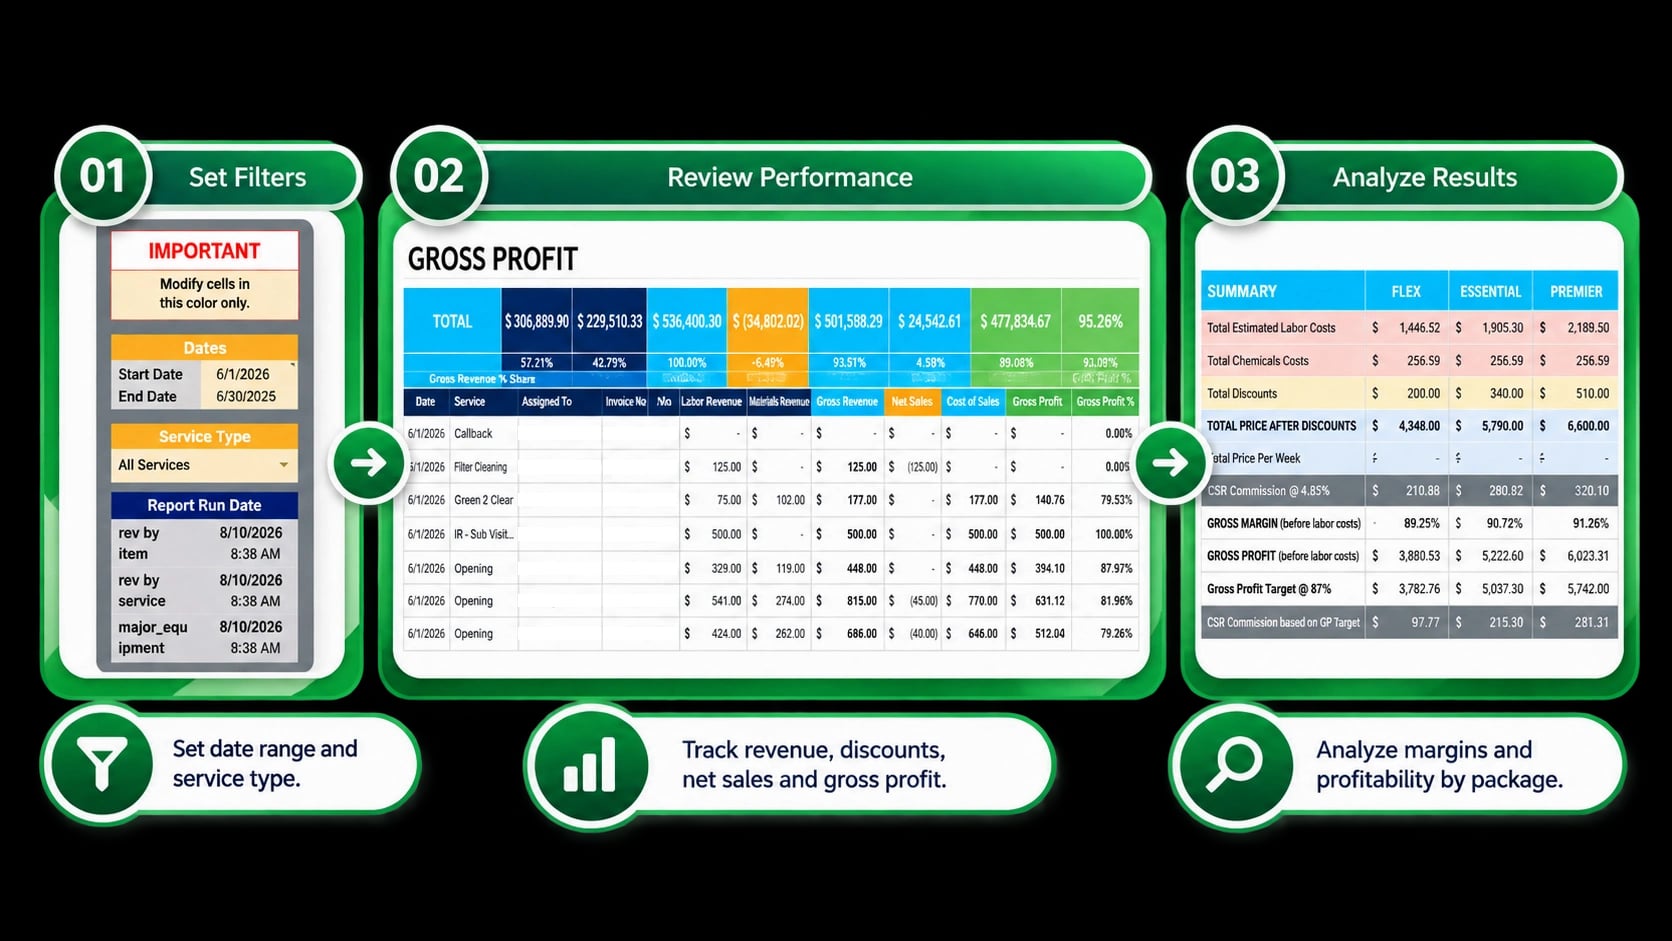
The report applies date and service filters to transaction-level revenue and cost data, calculates gross profit and margin, and extends the same logic to package comparisons covering labor, chemicals, discounts, commission, and target context.
VISUAL PROOF
Profitability in view
See revenue and costs move from filtered records to gross-profit and package-margin analysis.
THE OUTCOME
Profitability became visible alongside the activity that produced it.
WHAT BECAME VISIBLE
- Gross revenue, discounts, and net sales
- Cost of sales, gross profit, and gross-profit percentage
- Profitability by date range and service type
- Estimated labor and chemical costs by package
- Package margin, gross profit, commission, and target context
SYSTEM DETAILS
Project Details
- Category
- Dashboards & Reporting
- Type
- Business Reporting
- Status
- Completed
- Platform
- Google Sheets
Inputs
- Revenue
- Discounts
- Labor
- Materials and chemicals
Analysis
- Net sales
- Cost of sales
- Gross profit
- Gross margin
Comparison
- Date range
- Service type
- Package options
THE TAKEAWAY